- | Government Spending Government Spending
- | Data Visualizations Data Visualizations
- |
The Rapid Expansion of Federal Spending Per Household
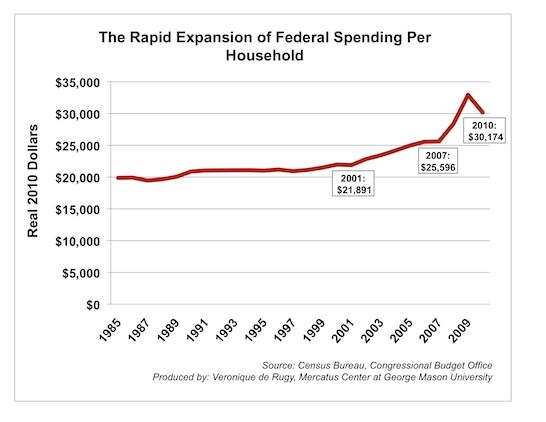
This chart by Mercatus Center Senior Research Fellow Veronique de Rugy illustrates the recent expansion of federal spending per American household, using household data from the United States Census.

This chart by Mercatus Center Senior Research Fellow Veronique de Rugy illustrates the recent expansion of federal spending per American household, using household data from the United States Census Bureau and spending data from the Congressional Budget Office. The red line tracks the evolution of federal spending per household in the United States since 1985, with all amounts presented in real 2010 dollars for comparability.
Since 2007, government spending per household has skyrocketed by $4,578. This year, the federal government has spent $30,174 per American household. That’s down from the 2009 level of $32,934 due to the end of some increased spending for TARP, Freddie Mac and Fannie Mae that were part of the 2008 financial rescue.
Since 2001, federal spending per household has been on an upward trajectory, deviating from its historical average: in 1985 the federal government spent 36% of the average household’s income; by 2009 this number had skyrocketed to 49%. For context, the mean household income in 2009 was $67,976; at $32,934 per household, government spending represented 48.4% of the average American household’s income in 2009.