With Jerome Powell’s reappointment as Federal Reserve chair seemingly secure in the midst of an ongoing debate about what the Fed should do, what can we say, if anything meaningful, about future inflation? Based on competing economic theories and current evidence, it’s a safe bet that more inflation will be coming our way. But it is a bet, and how the Fed responds is another matter. Let’s take a look.
There are currently two competing viewpoints from economists. On the one hand, there are those in the “monetarist” camp (such as John Greenwood and Steve Hanke), who follow Milton Friedman’s teachings and argue that inflation is first and foremost a monetary phenomenon. As they see it, when the federal government pumps large amounts of money into the economy—as it’s been doing since December 2019—then, all else equal, a rising price level will follow about two years later. That date’s getting uncomfortably close.
Countering this position are followers of the Modern Monetary Theory (MMT) school of thought, like Pace University economist Randall Wray. Noting that trillions of dollars have been printed and now rest in consumer checking and savings accounts, these economists present variations of Wray’s argument that “Money doesn’t cause inflation. Spending causes inflation.” As far as Professor Wray is concerned, Mr. Biden’s administration can continue to keep a foot on the spending pedal, and also safely print money to pay for it.
On this point, it’s possible for both monetarists and MMTers to be correct, which would mean we won’t have more worrisome inflation until consumer spending accelerates and the newly printed money starts chasing a limited supply of goods and services. Indeed, the basic theory of inflation developed more than a century ago contains a key that helps resolve the different viewpoints.
In an effort to explain inflation, monetarists have for years based their thinking on the 1911 work by economist Irving Fisher, “The Purchasing Power of Money.” Fisher developed an equation of exchange that goes like this: MV = PQ. M stands for money in the economy; V, the number of times the money circulates annually; P is the price level or price index; and Q is the level of real GDP.
Looking at the equation, we can see that if money (M) increases and velocity (V) remains unchanged, then price and GDP (P and Q), on the right-hand side, have to get larger. Continuing, if real GDP also doesn’t change, then price is what has to rise. This tells us that with $5 trillion having entered the economy—a better than 30% increase since December 2019—and real GDP growing by much less than 30%, inflation follows.
With a handle on these fundamentals, the next question we might ask is why inflation is running at only 6 percent, or even less.
The answer to the question has two parts. First, there is a time lag between government money going into consumer checking accounts and rising prices. Greenwood and Hanke suggest that, on average, the lag is two years. Our money increases have been phased in gradually over the last two years.
Second, we have to inquire about velocity. Look again at the equation. What if velocity (V) falls as money (M) rises? Indeed, it is possible that falling velocity could offset rising money supply growth. And if it did, we would have a situation where the MMTers are right in arguing that only spending, when it occurs, causes inflation—and where monetarists can still argue that increases in the money supply will ultimately lead to inflation, all else equal.
In the chart nearby, which I built using Federal Reserve quarterly data, I show U.S. money and velocity spanning January 2019 through July 2021. The money data are for M2, a commonly used money-supply measurement used in analyzing inflation.
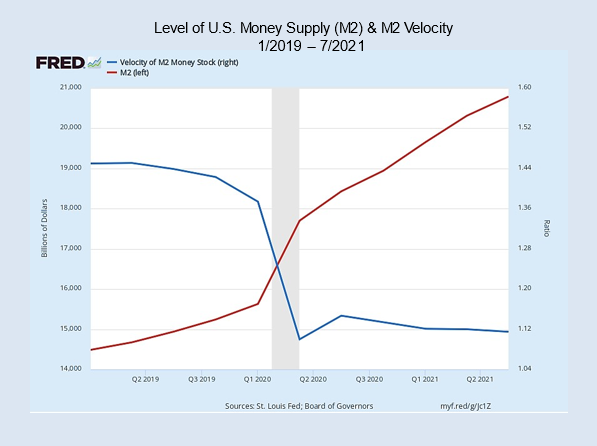
As the blue line indicates, velocity fell sharply just as the government was pumping more money into the economy and has remained at a low level. An interpretation of the chart suggests that we will not see inflation’s full effects until velocity recovers, which means until consumers start spending at a faster clip. The data in the chart also suggest that monetarists and MMTers can both be right about this. It’s a matter of time.
What might cause velocity to decrease or increase? The answer to the question has many moving parts. They include consumer perceptions of uncertainty with respect to health, employment, and future inflation. Will the schools reopen fully? Will I be able to get back to work and earn my former salary? Will COVID surge again? How much of the newly provided government money should I hold on to? Cautious consumers, it seems, leave money in the bank and velocity at a lower level.
Back to that inflation bet mentioned at the outset. I am betting that consumers’ uncertainty will dissipate, that velocity will begin to inch up, and that in 2022 and 2023, retail spending, travel, and other consumption activities will accelerate. That would mean persistent inflation.
This means that I am betting that the Fed, when observing the type of data I’ve presented here, will tap the brakes ever so gingerly, and make an effort to slow the economy with higher interest rates or other adjustments.
Keep in mind this is a bet.